Possibility of Strengthening Regional Value Chain and Economic Cooperation between South Korea and Lao PDR
Abstract
This paper suggests the possibility of strengthening regional value chain between South Korea and Lao PDR and reviews some of favorable conditions and challenges in terms of participating in Global value chains (GVCs). Even though the economy of Lao PDR showed the weakness in manufacturing sector, comparing to CMV (Cambodia, Myanmar, and Vietnam) and has retreated in terms of GVCs since 2011, the superiority of labor productivity could encourage offshoring of global foreign companies to Lao PDR as well as Vietnam following post China. However, Lao PDR needs to improve the trade facilitation if Lao PDR wants to increase the possibilities of Lao PDR in terms of participating in regional value chain network or GVCs.
초록
본 연구는 한-라오스 간 경제협력 및 지역가치사슬 강화 가능성을 분석하는 것이다. 비록 라오스의 경제가 캄보디아, 미얀마 베트남에 비해 제조업 분야에서 취약하고 2011년 이후 글로벌 가치사슬에서 후퇴하고 있지만, 이들 국가들과 비교해서 노동생산성에서의 우위는 다국적 기업의 유치에 유리한 조건일 뿐 아니라, 글로벌 가치사슬의 유리한 대상지로 부상할 수 있다. 하지만, 라오스는 글로벌 가치사슬 뿐 아니라, 지역가치사슬 합류를 위해서는 국제무역을 확대할 수 있는 방향으로 일반 수입관세 인하 및 비관세 장벽 제거 등의 정책을 펼쳐야 할 것이다.
Keywords:
Global Value Chains, Labor Productivity, Regional Value Chain Network, Revealed Comparative Advantage키워드:
글로벌 가치사슬, 노동생산성, 지역가치사슬, 비교우위1. Introduction
Since the establishment of diplomatic relations in 1995, the bilateraleconomic cooperation between Lao PDR and South Korea has gradually deepened in a range of areas, including trade, investment, and tourism.South Korea has emerged as the fifth largest foreign investor in Lao PDR, with cumulative amount of USD815 million from 1992 to 2017. Its investment fields are mainly in construction, retail trade, agriculture, professional services, and manufacturing.Two-way trade has increased from USD10 million in 1996 to USD68 million in 2017. In the area of tourism, the number of Korean visitorsto Lao PDR has witnessed a substantial increase, from 11,000 in 2006 to over 170,000 in 2017.Moreover, South Korea has become a significant development partner in supporting socio-economic development of Lao PDR, it provided bilateral grants with cumulative amount of USD335 million from 2006 to 2016, particularly to human resource, health, and rural development.
Besides their bilateral relations, both countries actively participate in regional frameworks such as ASEAN-South Korea, ASEAN+3, ASEAN+6. Most notably, both countries are participating in the Framework Agreement on Comprehensive Economic Cooperation between ASEAN-South Korea aimedfor establishing the ASEAN-South Korea Free Trade Area, known as AKFTA, covering trade in goods, trade in services,investment, and economic cooperation.The AKFTA is expected to scale up trade and investment flows between ASEAN and South Korea,which subsequently create more job opportunities and facilitate the transfer of advanced technology.
However, the economic cooperation between the two countries still have a lot of room for further improvement, especially considering the low level of their bilateral trade.Lao PDR and South Korea can further enhance economic cooperation and increase two-way trade volume through greater linkages of firms in the regional value chain network of both countries. The launch of ASEAN Economic Community (AEC) would be an opportunity for Korean firms to expand regional value chain as ASEAN moves towards achieving the AEC Blueprint 2025 with its characteristics of “a highly integrated and cohesive economy”. The broader objective of becoming a highly integrated and cohesive economy is to enhance the region’s participation in global value chains1)(GVCs).
This can contribute to strengthening and deepening the economiccooperation between Lao PDR and South Korea. Thispaper aims to1) provide an overview of progress in GVCs participation of Lao PDR; 2) explore the current situation of Lao PDR-South Korea economic cooperation; 3)assess the prospects for deepening GVCs and economic cooperation between Lao PDR and South Korea by reviewing some of favorable conditions and challenges.The rest of this paper is organized as follows: Section 2 describes Lao PDR’s participation in GVCs; Section 3 discusseseconomic cooperation between Lao PDR and South Korea; Section 4 and Section 5 provide review of some favorable condition and challenges and conclusions.
2. Overview of Lao PDR’s participation in GVCs
2.1 Domestic production structure
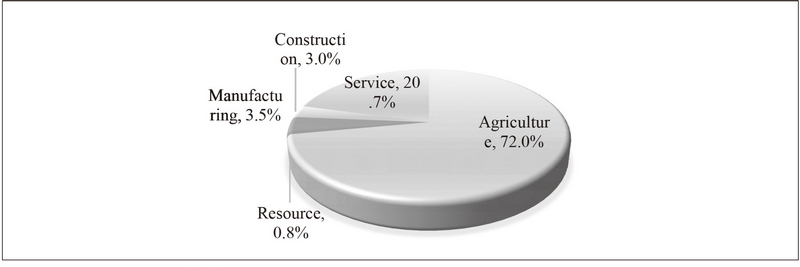
Lao PDR has experienced such a change in economic structure as shown in Table 1. Lao economy is largely characterized by few economic sectors where the natural resource sector, especially mining and hydropower electricity plays dominantly in the headline areas of production, investment and exports but not employment. Less than 1% of total employment are employed in this sector. In terms of production, resource industries are among the fastest sectors driving the Lao PDR’s economic growth since the early 2000s2) , leading to a change of economic structure towards a resource based economy. For instance, the share of the resource sector to GDP increased from 4.3% during 1998-2000 to 11.4% during 2013-2015 (See Table 1). Although the manufacturing sector raised its share steadily from 8.0% to 10.1% respectively, the share is still low when compared to neighboring countries. For example, the share of Lao manufacturing to GDP in ASEAN stayed at 7.5% in 2017, whereas the shares in Cambodia, Myanmar, and Vietnam were relatively higher with 16.2%, 23.7%, and 15.3% respectively. Service sector has become the largest sector, but the agricultural sector has shrunk by 20.7%. However,as of 2015 the majority of labor (72.0%) were still invested in this sector.Rice, maize, cassava, coffee and sugarcane are the main agricultural products of the Lao PDR sharing more than 90 percent of total agricultural land.
The manufacturing sector in the Lao PDR is largely dominated by micro and family sized firms. The latest Lao economic census in 2013 revealed that 15,573 manufacturing establishments (equivalent to 12.5% of all enterprises) were in operation, of which 74.5% were micro-enterprises with less than five employees (LSB, 2015). As for the rest, 14.3% of firms employed between five and nine persons, and 10.4% between 10 and 99 persons, and only 0.7% with more than 99 persons. Large enterprises are mainly garment factories owned by foreign investors engaging in simple labor-intensive production and tend to employ unskilled workers with cheap wages. As for those in the food-processing, furniture, and primary wood-processing industries they are mainly small and medium sized enterprises. Heavy and high-tech industries such as chemicals, metals, electronics, and machinery and equipment are rarely found in the Lao economy, so their share is less than 5% of all manufacturers. Also, food industry covers the largest share in manufacturing sector, followed by beverages and tobacco, and apparel. The share of the service sector is significant without a doubt. However, most of these enterprises are also small and medium sized too. More than 95%were small and medium sized, according to the LSB (2015). New shopping malls, telecommunications and financial institutions are among the large enterprises in service sector. In all firms, firms solely serving the domestic market (non-exporters) accounted for 97%,whilefirm both serving domestic market and exporting accounted for 1.6%, and solely-exporting firms (pure exporters) accounted for only 1.3%.
In summary, Lao PDR economy turned to the resource based economy and showed the weakness in manufacturing sector, comparing to CMV (Cambodia, Myanmar, and Vietnam). Service sector has become the largest sector, but the agricultural sector has shrunk by 20.7%. In terms of employment agricultural sector has the largest.
2.2 Lao PDR’s participation in GVCs
Due to data unavailability on GVCs participation, namely the GVCs participation index for Lao PDR, this paper uses data on intermediate goods exports instead to explainthe extent to which Lao PDR involves in global sourcing or offshoring.Also, this compares Lao PDR with CMV because these countries are the late comers to ASEAN competing with each other based on the robust economic growth. An intermediate goods can be defined as an input to the production process that has itself been produced and, unlike capital, is used up in production(Deardorff, 2006). Intermediate goods is referred to as parts, components, or processed goods for industry.
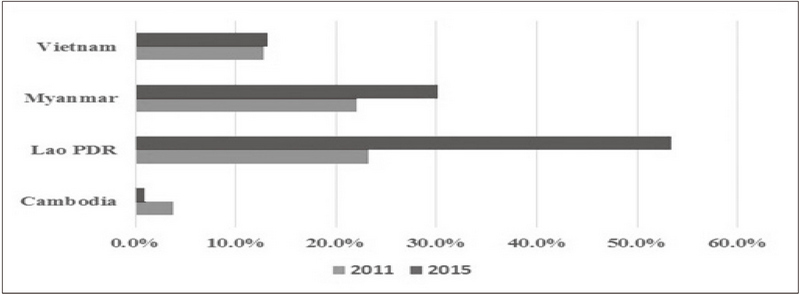
As shown in Figure 2 and Figure 3, Lao PDR has seen a decline in intermediate goods exports in terms of both value and share of intermediate goods in exports. In 2011,intermediate goods exports reached USD 932.5 million, accounting for 53.4% of total exports. In 2015, its value declined to USD 864.8 million or 23.3% of total exports. For Vietnam, intermediate goods exports increased substantially from USD 12.7 billion in 2011 to USD 20.8 billion in 2015. However, its share in total exports decreased marginally from 13.1% in 2011 to 12.8% in 2015. In case of Myanmar, the value increased marginally from USD 2.4 billion in 2011 to USD 2.7 billion in 2015 and its share in total exports declined substantially from 30.2% in 2011 to 22.1% in 2015. Cambodia’s intermediate goods exports rose substantially from only USD 56 million in 2011 to USD 327 million in 2016. Though its share in total exports was relative small, it rose from less than 1% in 2011 to 3.8% in 2015.
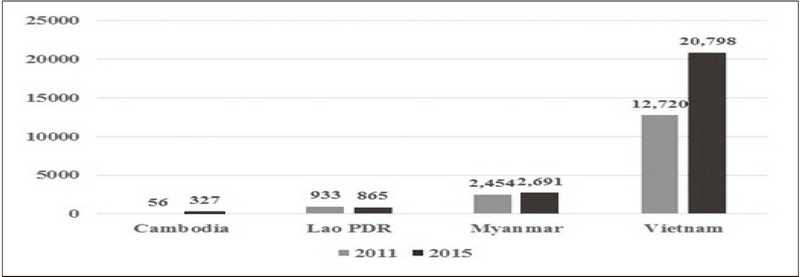
Intermediate Goods Exports (USD million)Source: World Bank’s WITS (WorldIntegrated Trade Solution) database
Finally, in terms of GVCs Lao PDR has retreated, but Vietnam strengthened the GVCs network. This implies the economic linkages of Vietnam have been enlarged in the world. Also, this is related to offshoring of global companies to Vietnam following post China. Cambodia records the lowest level in GVCs network. However, even though the major exports of the Lao PDR are largely regarded as primary products in the low value segment of GVCs, the Lao PDR can share a fraction of the benefits from its integration in GVCs.
3. Economic cooperation between Lao PDR and South Korea
3.1 Bilateral trade between Lao PDR and South Korea
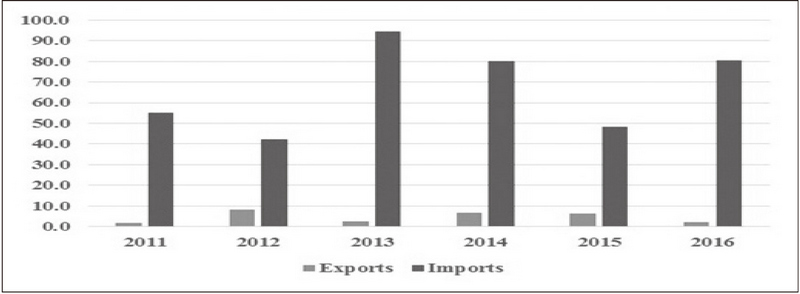
As shown in Figure 4, two-way trade between Lao PDR and South Korea expanded in 2011 to 2016. It was up from USD 56.8 million in 2011 to USD 82.4million in 2016. Exports to South Korea increased significantly from USD 1.7 million in 2011to USD 6.4 million in 2015 but it was down to USD 2.2 million in 2016, while imports from South Korea increased from USD 55.2 million in 2011 to USD 80.4 million in 2016.
As of 2016, Lao exports to South Korea amounted to USD 2.2 million, of which consumer goods accounted for 56.3%, followed by raw materials (29.83%). Among raw materials wood products had the highest ratio (49.4%) followed by vegetable (32.8%), textile and clothing (6.5%), and metals (3.35%) (See Table 2). In terms of regional value chain intermediate goods export by Lao PDR to South Korea records 11.33% which was lower than raw materials and consumer goods.
Revealed comparative advantage (RCA) is an indicator of export performance, identifying the sectors in which a country has a comparative advantage. The RCA index herein compares the share of exports in a particular goods sector of a country with the global share of exports in that samesector. A country with an RCA above one is considered to have a revealed comparative advantage in that sector. The higher the ratio, the more competitive is the country. As shown in Table 2, wood product, vegetable, chemicals, intermediate goods, and consumer goods had comparative advantage (RCA > 1) in the South Korea market, among them, wood product was said to have the highest comparative advantage.
As of 2016, the main product imports from South Korea were capital goods (58.07%) followed by consumer goods (38.55%). However, the ratio of intermediate goods and raw materials were very small. Among raw materials transportation accounted for 68.6% followed by mach and elec (19.38%) in Table 3.Products which have comparative advantage in Lao market included transportation, capital goods, footwear, textiles and clothing, and consumer goods. Among them, transport equipment was said to be the highest comparative advantage.
Consequently, in terms of regional value chain network between Lao PDR and South Korea, Lao PDR actively participates in production process in South Korea through exporting intermediate goods. However, Lao PDR highly depends on the capital goods and consumer goods from South Korea.
3.2 Foreign direct investment
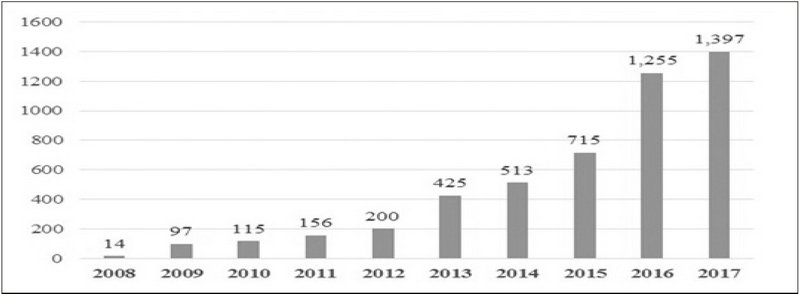
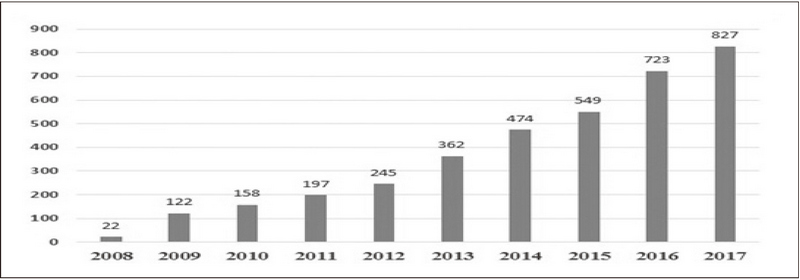
South Korea has become the fifth largest foreign investor in Lao PDR, just behind China, Thailand, Vietnam and France. In fact, South Korea started investing in Lao PDR since 1992. Given data availability, the flows of registered capital made by South Korean investors rose significantly from USD 14.5 million in 2008 to USD 539 million and USD 142.5 million in 2016 and 2017, respectively. In cumulative value, registered capital amounted to about USD 1.4 billion as shown in Figure 5. In terms of number of firms, it increased substantially from 22 firms in 2008 to 104 firms in 2017 and totally, there were 827 firms (See Figure 6).
By sector, in terms of cumulative registered capital, the South Korean investment was mainly in construction which accounted for about 42%, followed by wholesale and retail (13.2%), agriculture (11%), professional services (7%), and manufacturing (7%).
3.3 Tourism
Tourism can contribute to integrating the Lao economy more into the regional value chain and GVCs because the global inward demand is important for the growth of the Lao economy considering the small and limited domestic market.In recent years, Lao PDR has experienced a tremendous rise in the number of Korean tourists making them the fourth largest group of foreign tourists coming to Lao PDR (behind Thai, Vietnamese and Chinese) (See Table 4). The number of Korean visitors to Lao PDR rose significantly from 34,707 in 2011 to 170,571 in 2017.
4. Review of some favorable condition and challenges
According to Kowalskyet al.(2015), the main structural factors such as the size of the economy or the distance to manufacturing hubs, trade and investment openness, logistics performance, hard and soft infrastructure, and good governance, are the key drivers of participation in GVCs. This section provides an overview of some factors such as trade facilitation and labor productivity in the Lao context.
4.1 Trade facilitation
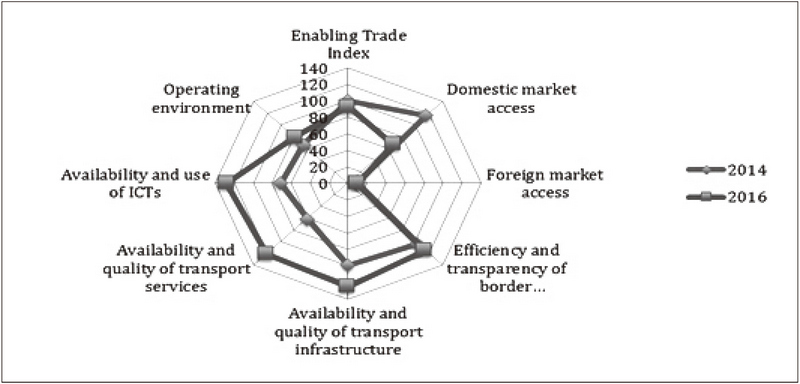
Global enabling trade index (ETI) is developed by the World Economic Forum, which is composed of market access, border administration, infrastructure, and operating environment. In 2016, Lao PDR was ranked 93 out of 136 countries, improved from its ranking of 100 in 2014. As shown in Figure 7, considering the efficiency and transparency of border administration in 2016, it became poorer as compared to that in2014. Similarly, in terms of availability and quality of transport infrastructure, availability and quality of transport services, operating environment, and availability and use of ICTs, all of these became poorer than that in the previous year.
In terms of trading across border, Lao PDR still lags behind ASEAN neighbors in terms of ease of trading across borders. According to the World Bank’s Doing Business data in 2017, the time and cost associated with documentary compliance required to export are 216 hours and USD 235, respectively compared with ASEAN neighbors - Thailand (11 hours, USD 97), Vietnam (50 hours, USD 139), Cambodia (132 hours, USD 100), and Myanmar (144 hours, USD 140).This could lead to limit the possibilities of Lao PDR in terms of participating in regional value chain network or GVCs.
However, the central government has set a target to transform the Lao PDR from a land-locked country to a land-linked country while also becoming a logistics hub for the region by 2020 as outlined in the Infrastructure Master Plan. The aim is to facilitate the Greater Mekong Sub-region highway corridors to economic corridors3) by integrating road development with industrial areas and other economic drivers. This is positive and benefit for participating in regional value chain network or GVCs.
4.2 Labor productivity
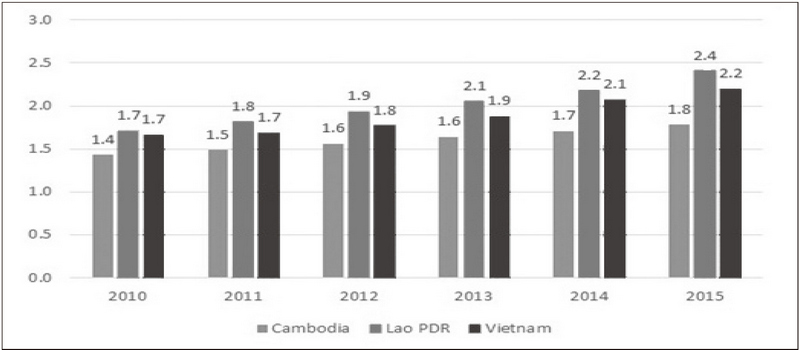
This section provides the output per worker, known as labor productivity in Lao PDR. The paper uses the labor productivity index based on hours worked which is developed by the Asian Productivity Organization. As shown in Figure 8, labor productivity improved over time, it increased from 1.7 in 2010 to 2.4 in 2015. Comparing Lao PDR to Cambodia and Vietnam, labor productivity seemed to higher than any other. This implies the superiority of labor productivity encourages offshoring of global foreign companies to Lao PDR as well as Vietnam following post China.
5. Conclusions and the way forward
This paper suggests the possibility of strengthening regional value chain between South Korea and Lao PDR and reviews some of favorable conditions and challenges in terms of participating in GVCs. Even though the economy of Lao PDR showed the weakness in manufacturing sector, comparing to CMV (Cambodia, Myanmar, and Vietnam) and has retreated in terms of GVCs since 2011, the superiority of labor productivity could encourage offshoring of global foreign companies to Lao PDR as well as Vietnam following post China. However, Lao PDR needs to improve the trade facilitation in terms of availability and quality of transport infrastructure, availability and quality of transport services, operating environment, and availability and use of ICTs. This inferior could limit the possibilities of Lao PDR in terms of participating in regional value chain network or GVCs, comparing to CMV.
With regarding to regional value chain between South Korea and Lao PDR, Lao PDR actively participates in production process in South Korea through exporting intermediate goods. However, Lao PDR highly depended on the capital goods and consumer goods from South Korea. The exporting of intermediate goods to South Korea need to be enlarged because it has the higher comparative advantage, to strengthen the economic cooperation between two countries. In addition, Lao PDR needs to deepen the economic cooperation and to build regional value chain between Lao PDR and South Korea for strengthening the export of garment sector which is driving Lao exports. For example, the garment industry can contribute to the backward and forward linkages among the production process. The backward industry for garment sector includes the supply of raw materials and components such as natural and synthetic fibers, yarn, and fabrics. On the other hand, the forward industry refers to the design, branding, marketing and distribution. Therefore, the regional value chain between Lao PDR and South Korea can contribute to the growth of the garment industry in Lao PDR.
Considering the current level of their bilateral trade, there still have a lot of room for further improvement. The key factors such as the size of the economy, the distance to manufacturing hubs, trade and investment openness, logistics performance, hard and soft infrastructure, and good governance, are the key drivers of participation in GVCs. However, the performance of Lao PDR is still poor compared to its neighbors. Lao PDR will be the target of GVCs network when it has maintained an advantage in terms of labor productivity based on institutional and political stability and labor market efficiency. In the further study, with regarding to the key drivers of participation in GVCs SWOT analysis for the Lao economy will be needed. In addition, productive capacity indicators such as airports, railways, human capital and technological readiness need to be studied to hasten the progress of economic complexity and the integration into GVCs for the Lao economy.
Notes
References
-
Deardorff, A. V.(2006). Terms of Trade: Glossary of International Economics, World Scientific Publishing: Singapore.
[https://doi.org/10.1142/9789812774538]

- Kowalski, P., Gonzalez, J. L.,Ragoussis, A. &Ugarte, C.(2015). Participation of Developing Countries in Global Value Chains: Implication for Trade and Trade-related Policies, OECD Trade Policy Paper, No. 179.
- Lao Statistics Bureau(2015). Economic Census II 2013.
- Lao Statistics Bureau(2015). Lao Social Indicator Survey.
- Ministry of Industry and Commerce(2018). Report on Industrial Development of Lao PDR 2017.
- Ministry of Planning and Investment(2016). 8th Five-Year National Socioeconomic Development Plan (2016–2020)
- https://data.aseanstats.org/, ASEAN Stats Data Portal
- http://www.apo-tokyo.org/, Asian Productivity Organization’s database
- https://www.lsb.gov.la/en/#.XBhZL--JhD8, Lao Statistics Bureau
- http://www.moic.gov.la/?lang=en, Lao PDR Ministry of Industry and Commerce
- https://wits.worldbank.org/, World Bank’s WITS (World Integrated Trade Solution) database
- http://www.weforum.org, World Economic Forum
Changkeun Lee is Ph.D in economics. He experienced the associate research professor in Seoul National University and is working in Research Institute of Agriculture and Life Science in Seoul National University. He is expert in regional and urban economics and has been studying for the regional disparity, the regional policy, and the creative economy. Many articles such as “Measuring Neighboring Effects on Poverty in Regional Economies (2019)”, “The creative economy leads the economic growth and creates jobs during the recessions in Korea(2018)”, “Mobility of Workers and Population between Old and New Capital Cities Using the Interregional Economic Model (2017)” have been published in SSCI and international journals or national journals.
Chansamone Vongphaisitis workingas a researcher at the Center for Enterprise Development and International Integration Policy, the National Institute for Economic Research (NIER) in Lao PDR. His current research interests focus on the Lao PDR’s integration into regional economy, GVCs participation, and their implications and impact. The most recent research projects include the study on the impact of ASEAN Economic Community (AEC) on trade and FDI for Lao PDR; gaining access to regional markets of the Lower Mekong countries; and the impact of non-tariff measures (NTMs) on Lao exports in ASEAN+1 FTAs.

